I use an app called NightGuard to track my Type 1 Diabetic (T1D) son’s blood glucose levels (BGL) and alert me if he needs some food or insulin. I love NightGuard. It is one of the most important applications I use to manage T1D.
One of NightGuard’s best features is its predictive alerts. These alerts use regression models to try predict BGL and notify of future problems. In this post I am going to explore the way NightGuard uses regression and see if I can improve its outcomes.
NightGuard
A Continuous Glucose Monitor (CGM) reads Sam’s BGL every 5 minutes, sends it to a service called NightScout, which is consumed on my phone by NightGuard. A core feature of NightGuard is that it alerts me if Sam’s BGL is too low or too high:
- Low is below 72ml/dl (4mmol/L)
- High is above 180mg/dl (10mmol/L)
- In Range is between Low and High
The actions I can take when getting an alert are:
- Reduce BGL with Insulin: this can take an hour to have proper effect
- Increase BGL with Carby Food: this can take 20 mins to take effect
- Wait and see if a previous action will take effect
Note: If a diabetic is acting strange, give food (if conscious) then call an ambulance!
Given the delays insulin and food have, managing diabetes requires treating problems that have not yet occurred. Being able to accurately predict future issues would make life with T1D much easier and safer.
NightGuard has a prediction algorithm that uses the last couple (2 or 3) BGL readings as training data for multiple regression models. By calculating the error against the training data, it selects a model to predict future values.
This method has one big problem. Using the training data as a means of selection might result in a model that fits the training data perfectly, but not accurately predict the future.
Lets look at the actual models.
Regression with Least Squares Estimation
The algorithm used by NightGuard to create the regression models is the Least Squares Estimation using LU decomposition. The models NightGuard use are:
- Linear
ax + c - Quadratic
ax² + bx + c - Exp
log(y) = x - Log
y = log(x) - LogLog
log(y) = log(x) - Sqrt
y = sqrt(x)
Lets look at an example of each of these models: given three readings in a row 180,165,165, what will each of these models predict?

Linear and Exp both predict BGL will continue to drop, the rest predict it to rise, with Quadratic being the most extreme. In this example, NightGuard would select the Quadratic model because it can construct a quadratic curve that perfectly hits all the data points.
As someone who has managed T1D for a few years now, I would not think the Quadratic model is correct, but lets look at the data.
Results
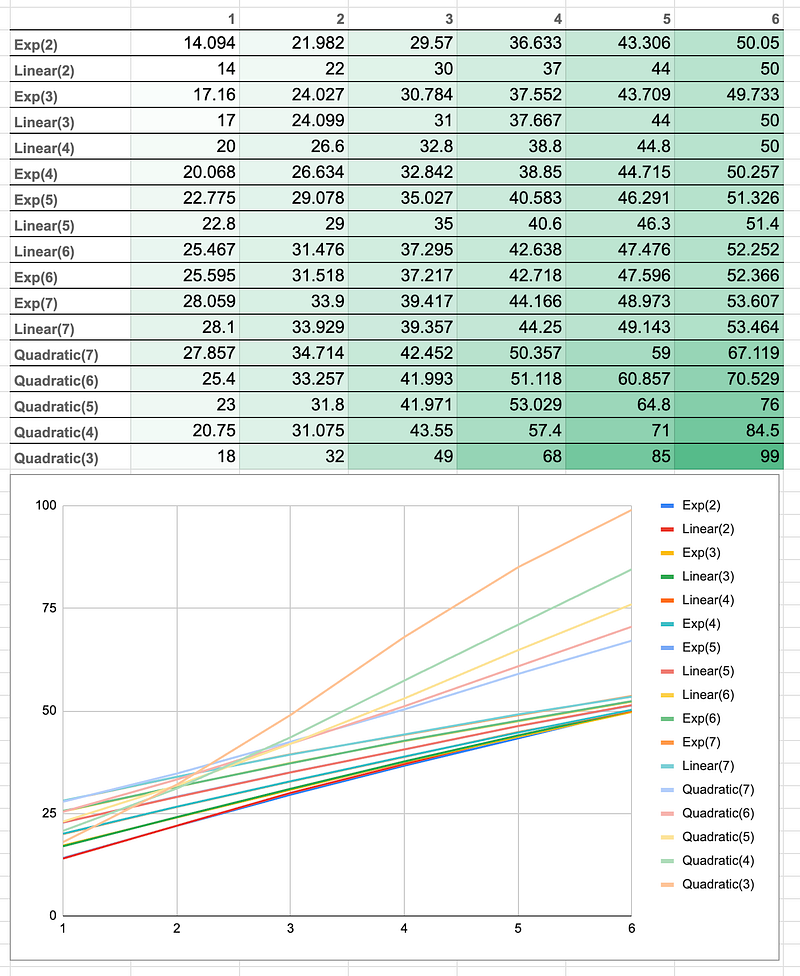
I got 90 days (over 20k readings) of Sam’s data from TidePool, then implemented the models, including adjusting for training data, e.g. Linear(2) is a Linear regression using 2 previous readings. I was able to simulate and compare these models using root mean squared error (RMSE) against real data 1–6 readings in the future (5–30 minutes).
 Best Models w.r.t. RMSE.
 _Log,_ __ _LogLog_ and _Sqrt_ were removed because they were trash.
This shows that Exp(2) and Linear(2) have the least error, while all Quadratic models have high errors.
Feature Implementations
Evaluating the models by only RMSE may not result in the best models w.r.t. the features NightGuard has. To make sure the models are good, I tested them against real features:
Predictive Low Alert: alert when the model predicts BGL will go low.Smart Low Snooze: if already low, snooze alert if the model predicts BGL to rise into range.
I looked at these features as if they were Binary Classifiers; the models are used to calculate the number True Positive (TP), False Positives (FP), True Negatives (TN) and False Negative (FN) values. For our features:
- A FN for
Predictive Low Alertwould be not alerting if about to go low (unsafe), a FP would be alerting when it was not needed (annoying). - A FP for
Smart Low Snoozewould be snoozing an exiting low alert incorrectly assuming BGL will rise (unsafe), a FN would be not snoozing an alert when the BGL will recover (annoying).
Each of these factors have a very different level of risk:
- If a
Predictive Low Alertis always incorrect, then I will be annoyed with to many alarms. - If
Smart Low Snoozeis always incorrect, then it might snooze real alarms and put Sam in a life threatening situation.
This risk must be taken into consideration.
I was able to run these features against the above collected 90 days worth of Sam’s data. A pretty good metric to compare the models for Predictive Low Alert is F-Score:
 F-Score favouring agressive models
The F-Score for Smart Low Snooze:

F-Score for both features select the most aggressive models, the ones that return True the most, Quadratic(3) and Linear(7). Using predictions 20mins out, over the 80 days:
Quadratic(3)would alert 5135 times, 308 being correct.Linear(7)would sleep 930 alarms, 563 correctly.
Both Quadratic(3) and Linear(7) had the highest TP values and the highest FP values. I would prefer a less activley reckless model.
I tried a bunch of different metrics that (IMHO) overweighted TP values v.s. the risks of FN and FP. I ended up measuring the models with a simple weighted sum of their positions based on 20mins (4 readings), e.g. Exp(2) has the 1st least FP and the 8th least FN, so p(FP) = 1 & p(FN) = 8.
- For
Predictive Low Alertthe weight is calculated3*p(FN) + 2*p(FP) + p(TP) - For
Smart Low Snoozethe weight is calculatedp(FN) + 10*p(FP) + p(TP)
Here are the results:

Look at that, Exp(2), is near the top of both these lists. I think that inaccurate models, like Quadratic(3), are at the top because they assume Sam will come out of a Low quickly, after we have already treated the low. I think if I removed data that occurred after a treatment we would see that value of Quadratic(3) model decrease.
Comparison with other models
This 2020 paper has a useful table to compare my models against:

Exp(2) has an RMSE at 30 minutes (for just Sam) of 50.05. That is nearly 7x WORSE as the best model using only CGM data as input. These models have a long way to go before they are top notch.
Conclusions
This is not a scientific study, it is not broadly applicable, and it might be wrong. In this post, I am trying to understand the problems with predicting future BGL levels with the minimum amount of data available. I think this is a pretty good start.
Exp(2) is a good enough model for now. Last night I was woken twice by NightGuard predicting lows (one of them correct). If I were using Exp(2) it would have only woken me for the actual low. This is good enough reason to go ahead with this model.